This is a pretty long post, over 5000 words in total. It’s okay to skim the content using the table of contents below. Or you could download the pdf version for later read at your convenience.
Let’s face it – digital marketing is all about the numbers, this is where digital marketing statistics come in.
Whether you’re a starting business or a large company looking for a new brand campaign, statistics are an invaluable tool to make informed decisions. In fact, intelligent use of statistics can be the difference between an effective digital marketing strategy and one that totally fails to capture potential customers.
If you can measure it, you can manage it. And indeed, statistical data makes for better business management – it helps you identify market trends, classify your target audience accurately, and evaluate the potential success of your marketing strategy.
Ready to find out what the numbers say? Here is a list of more than 200 digital marketing statistics that every business owner needs to know:
Digital Marketing Statistics (Infographics)
Digital Marketing Statistics-SEO Statistics
Conversion Rate Optimization
- The world’s top converting companies spend more than 5% of their marketing budget on optimization. These businesses spend an average of $2000 per month on conversion rate optimization (CRO) tools for analyzing, testing, and measuring. (Forbes, 2019)
- The overall average conversion rate for websites is 2.35%. This means that out of 40 visitors, only 1 actually makes a purchase or clicks on a survey. (Wordstream, 2019)
- Conversion rates vary from one industry to another. Three of the best performing industries include food, beverage, and tobacco industry at 4.95%, health, and beauty at 3.8%, and electronics at 3.5%. (Yotpo, 2020)
- This may come as a surprise, but many industries are not satisfied with their conversion performance. On an estimated 22% of businesses are actually happy with their current conversion rates. (Letstalkaboutmoney.com)
- Using videos on a landing page can improve conversion rates by 86%. Consumers trust a product they can see in action. (Wordstream.com)
- For businesses investing in CRO tools, the average rate of ROI is a whopping 223%. (Omnidigit.com)
- Having more landing pages is beneficial for B2Bs. In 2019, Hubspot reported that companies maintaining 10-15 landing pages gets 55% more leads compared to companies with less than 10 landing pages. (Hubspot, 2019)
- Although this number may vary depending on your business and products, landing pages have also been found to produce 220% more leads than a standard call to action. (Impactbnd.com)
- Despite the proven importance of landing pages, many B2B businesses fail to use them as a marketing tool. In 2019, 44% of clicks to B2B link direct users to a homepage, instead of a dedicated landing page. (Outgrow.co)
Organic Search
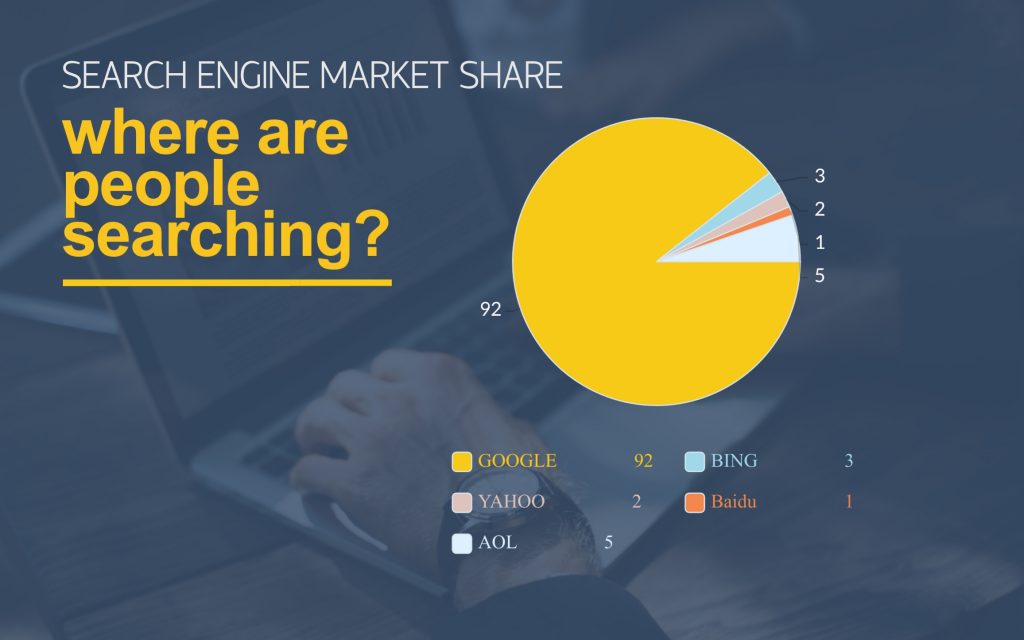
- Organic search is the largest source of website traffic. It drives up 93% of search consumption (SEOtribunal.com)
- 70-80% of search engine users completely ignore paid ads and focus only on organic search results. (NewMediaCampaigns)
- Google dominates the search engines and accounts for approximately 92.42% of all search traffic. It now boasts of over 7 billion search queries per day. (StatCounter)
- 15% of Google queries per day have never been searched for on Google before. (Webhostingrating.com)
- Next to Google, other popular search engines include Bing at 2.61%, Yahoo at 1.9%, and Baidu at 1.03%. (Campaignmonitor.com)
- 67% of clicks go to the first 5 results displayed in search engines. (Advanced Web Ranking)
- Having a video thumbnail in the search results will significantly double search traffic. (Omnicore)
- 84% of people will abandon a purchase if they’re dealing with an unsecured website. Some search engines like Google have added a safety feature by labeling websites without HTTPs as “not secure.” (Modern Technolab)
Ecommerce
- The total average that each US consumer spends on eCommerce every year is $1800. (Statista)
- In the year 2018, up to 12% of all retail sales around the world were attributed to eCommerce transactions. (Statista)
- Global B2C eCommerce sales have been skyrocketing this year and are estimated to reach up to $4.5 trillion by the year 2021. (Hubspot)
- Of all current eCommerce platforms, Amazon makes 44% of total US eCommerce sales. (CNBC)
- 43% of eCommerce traffic comes from organic Google searches. (Wolfgang Digital)
- In the US alone, there are already 224 million digital shoppers. (aptitude.com)
- 71% of shoppers believe they can get a better deal if they shop online compared to physical stores. (Hubspot)
- Ecommerce has an impressive global growth rate at 23% per year. (Experian)
- Despite the increasing popularity of eCommerce, only 28% of small businesses in the US are currently selling their products online. (flow.io)
- A huge chunk of eCommerce sales comes from online grocery shopping. By 2025, online grocery shopping is expected to reach $100 billion, surpassing the total market by 20%. (forbes.com)
- A simple 1-second delay in page loading can cost you up to 7% of eCommerce conversions. (neilpatel.com)
- 28% of eCommerce shoppers are more likely to abandon their shopping carts if they find the shipping and freight cost too high. (fortunly.com)
Local SEO
- Within a day, 76% of people who search for something nearby on their smartphone will visit a related business, and 28% result in an actual purchase. (Embryo Digital)
- “Near me” searches have grown by 900% in the past two years. (Hubspot)
- 72% of buyers who visit a physical store will most likely also search online for another store within 5 miles. (Omnicore)
- 40% of mobile phone users are constantly searching for local businesses near them. (Omnicore)
- 46% of buyers will check online first for available stocks before going to an actual physical store. (Think with Google)
Voice Search
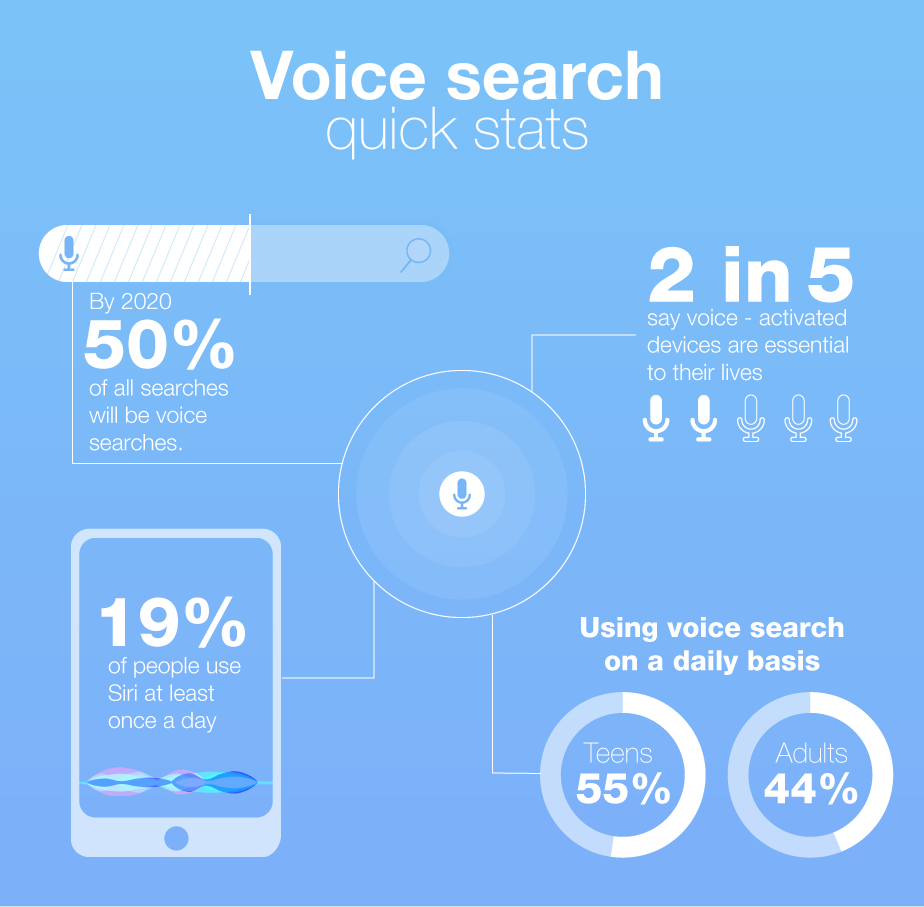
Source Omnicoreagency
- The highest increase in voice searches occurred in 2017, making up a total of 60% of searches during that year. (Omnicore)
- 111.8 million people in the US are using voice search features. (Emarketer)
- Voice searches are more popular than typing, with up to 71% of consumers showing a preference towards voice searches. (PWC)
- In 2018, 23% of households in the US own at least one smart speaker. (Microsoft)
- 51% of online shoppers use voice assistance features to help them search for products to purchase. (Oberlo)
Mobile Search
- 39% of mobile phone users prefer using a mobile app compared to the main browser page because they find it easier and more convenient to operate. (Pewresearch)
- 87% of online users in America use more than one mobile device when going on the internet. (Pewresearch)
- Traffic from mobile websites has made up more than half of all internet traffic since the year 2017. (Statista, 2020).
Digital Marketing Statistics-Social Media Statistics
- As of March 2020, there are a total of 2.32 billion accounts on Facebook and more than 50 million pages. (Statista)
- Out of this number, 270 million account profiles are fake. (Omnicore)
- 6% of the digital time across the globe is spent using Facebook (Sproutsocial)
- The average person spends around 20 minutes browsing Facebook. (Omnicore)
- 51% of American teenagers between the ages of 13 and 17 use Facebook on a daily basis. (Hootsuite)
- More women use Facebook than men. 74% of Facebook users are female. (Hootsuite.com)
- With more than 280 million local Facebook users, India ranks as number one in the most number of active Facebook users. (Statista,2020)
- The amount spent on Facebook ads increases by at least 62% every year. (Facebook)
- Every day, 35 million people update their Facebook statuses. (Wordstream.com)
- More than 80 million small scale businesses incorporate Facebook’s free business tools into their marketing strategies. (Facebook)
- A post that has more than 1500 words will likely have 22.6% more Facebook likes. (Hootsuite)
- 88% of all Facebook users log in using their mobile devices. (Businessofapps.com)
- With more than 50% using it, Facebook Messenger is the top messaging service. Whatsapp comes in a close second. (Businessofapps.com)
- 65% of adult Facebook users are between the ages of 50 and 64. (Omnicore.com)
- As of January 2020, LinkedIn now has 500 million users. (Omnicore)
- The United States has the most number of LinkedIn users in the world, reaching up to 160 million in April 2020. (Statista)
- 83% of businesses around the world use LinkedIn for content marketing (Hubspot)
- More men use LinkedIn than women. 57% of users are male. (Statista)
- Every week, eight new LinkedIn groups are created covering different niches and categories. (Fivechannels)
- Almost 40% of LinkedIn users pay for premium account privileges (Techjury)
- 98% of sales representatives with more than 5000 connections are more likely to surpass their sales quotas. (Vividfish)
- Pinterest currently has 322 million monthly active users. (Pinterest)
- Pinterest is predominantly a female platform. Seven out of ten Pinterest users are female. (Omnicoreagency)
- Food is the most searchable category on Pinterest, with more than 57% of users discussing food-related topics. (Smallbusiness)
- In the United States, Pinterest users are between the ages of 30 and 49. (Oberlo.com)
- Today, there are more than 200 billion pins saved on Pinterest. (Pinterest)
- 28% of all marketers use Pinterest for business-related purposes. (Hootsuite.com)
- Every day, more than 500 million Instagram are actively using the app. (Statista.com)
- An average of 100 million photos and 400 million stories are uploaded onto Instagram daily, (Statista.com)
- On average, there are a total of 4.2 billion Instagram likes in a single day. (Omnicoreagancy.com)
- Instagram users are more likely to engage with video posts compared to ordinary photos or image posts, with an overall rate of 38%. (Sproutsocial.com)
- The most used emoji is the heart. In 2018 alone, it was used more than 14 billion times on Instagram. (Hootsuite.com)
- 71% of businesses in America use Instagram as part of their digital marketing strategy. (Hootsuite.com)
- 80% of Instagram users follow a business or business-related account. (Hubspot.com)
- The most posted Instagram food is pizza! This is followed by sushi and steak as a close second. (Telegraph.co.uk)
Snapchat
- There are currently 218 million active Snapchat users every day. (Statista.com)
- 3 billion snaps consisting of both photos and videos are created daily. (Oberlo.com)
- In 2019, Snapchat generated $561 million in revenue. (Omnicore)
- An average Snapchat user opens the app at least 30 times per day (Omnicore)
- 55% of Snapchat users follow a business, brand, or company. (Omnicore)
- A total of $90 million was spent by different businesses around the world on Snapchat ads. (Omnicore)
- The highest percentage of users (38%) comes from the Gen Z population. (Workdesign.com)
- There are currently 1.3 billion accounts on Twitter. (Statusbrew.com)
- Only 328 million Twitter accounts are still active. (Statusbrew.com)
- 6000 Tweets are made per second. (Brandwatch.com)
- An average Twitter user has more or less 707 followers. (Hubspot.com)
- 77% percent of Twitter users are more likely to put their trust in a brand and make a purchase when their tweets have been responded to. (Omnicoreagency.com)
- More than 66% of small scale businesses own a Twitter account. (Oberlo.com)
- Twitter currently supports more than 40 different languages. (Omnicoreagency.com)
- 83% of world leaders have an official Twitter account. (Brandwatch.com))
- The Tweet with the most likes in the year 2019 was a post-Korean pop group BTS with more than 1 million likes. (Twitter, 2020)
- The most popular Tweet of all time is from Barack Obama in 2017, with 4.3 million likes. (Marketwatch.com)
- 80% of Twitter uses access the app using their mobile device. (Omnicore)
Digital Marketing Statistics-Mobile Marketing Statistics
- Mobile users make up most of the world’s online population, with 5.11 billion regularly using their mobile devices. (Datareportal.com)
- The average person spends at least 3 hours on their mobile device. (EMarketer)
- 91% of mobile users say they bring their mobile devices with them wherever they go. (Omnicore)
- 50% of mobile users immediately reach for their mobile devices when they wake up. (Medium.com)
- More than half of online shoppers have made a purchase using their mobile device. (Oberlo.com)
- Smartphones are more widely used than tablets. The usage rate is around 37%. (Pewresearch.org)
- Mobile ads have 5 times better conversion rates than website ads. (Wordstream.com)
- Most businesses say they allocate more than 50% of their digital marketing budget for mobile ads. (Omnicore)
- In 2017, mobile ad spend exceeded $143 billion across the globe. (Omnicoreagency.com)
- More than 50% of buyers prefer mobile-optimized websites rather than non-mobile optimized ones. (Smartinsights.com)
- 60% of smartphone owners report that they get spam texts or unwanted calls at least once a month. (Mashable.com)
Digital Marketing Statistics-Content Marketing Statistics
Source Omnicoreagency
Blogging
- In 2020, there are a reported 600 million blogs around the world. (Websitehostrating.com)
- Americans love to blog. In the US alone, an estimated 1.7 million people have their own blogs. (Websitehostrating.com)
- The average length of a single blog post is 2000 words. (Neilpatel.com)
- But experts agree that for a blog to effectively gain traffic, a single post should be between 1000 to 1500 words long. (Omnicore)
- Despite the recommended length for blog content, an average user only spends 37 seconds reading a blog post. They spend most of the time skimming through the content instead of actually reading every word. (Neilpatel.com)
- Because of the highly conversational tone of most blog posts, 61% of readers will make a purchase based on a blogger’s recommendation. (Quicksprout.com)
- The most popular blog posts in terms of purchasing power are how-to blogs. (Neilpatel.com)
- Businesses that blog generate up to 55% more web traffic. (hubspot.com)
- Blog posts with the best organic search results are those that contain videos or photos. The conversion rate increases by up to 157%. (Omnicore)
- WordPress has 60 million blogs while Tumblr has 440 million. (Optimonster.com)
- A new blog post is published every .05 seconds. (99firms.com)
- Most bloggers are between the ages of 30 and 39. (99firms.com)
Content Strategy
- 70% of businesses have incorporated content marketing into their overall digital marketing strategy. (Hubspot)
- In content marketing, the most common way to measure conversion rates is through total sales. (Hubspot)
- 67% of businesses use organic traffic to measure their content success. (SEMrush)
- 42% of companies hire a designated content strategist to ensure that they produce content that meets their branding expectations. (Omnicore)
Podcasts
- Part of the appeal of podcasts is that they allow listeners to multi-task. 49% of podcasts are listened to at home, while 22% of listeners listen to podcasts while driving or commuting. (Convinceandconvert.com)
- South Korea has the highest number of podcast listeners at 58%. This is followed by Spain at 40% and Sweden with 36%. (Gritdaily.com)
- As of 2019, there are 525,000 active podcast shows and more than 18 million podcast episodes. (FastCompany)
- More than 60 million American homes are podcast fans. (Nielsen Podcast Listener)
- Podcast users listen to an average of 7 different shows every week. (Nielsen Podcast Listener)
- 40% of Americans who are 54 years old or younger listen to podcasts. (Edison Research)
- Only 10% of total podcasters broadcast their podcasts live. (Podcast Host Gear Survey)
- The most popular podcasting software is Audacity, with more than 48% of podcasters using it to edit their shows. (Podcast Host Gear Survey)
Digital Marketing Statistics-Email Marketing Statistics
Click-through Rate
- Emails drive one of the best conversion rates. In 2018, 17% of clicked through emails resulted in purchases. (Campaignmonitor.com)
- One of the highest click-through email campaigns is “Email My Cart,” with almost 40% of recipients actually clicking on the email. (Barilliance)
- Personalized email messages improve click-through rates by at least 14%. (Campaign Monitor)
- Segmented or targeted emails have higher click-through rates than non-segmented ones. (Mailchimp)
- Welcome emails build your relationship with your consumers and generate 5 times more clicks than regular emails. (pure360.com)
- The best time of day to send an email for better click-through rates is between 10 and 11 in the morning. (Sleeknote)
Email Usage
- In 2019, there were a total of 3.9 million email users. This number is estimated to grow to up to 4.3 billion after 3 years. (Statista)
- In a single day, 293 billion different emails are sent and received across the world. (Statista)
- 81% of small business owners say that email is their number one tool of acquiring prospective customers. (Oberlo.com)
- Adding interactive content like photos and videos to emails can massively increase click rates by up to 300%. (Martech Advisor)
- Email has one of the highest ROI rates and drastically improves sales. The average return for email marketing is $44.24 for every dollar. (Oberlo.com)
- For better consumer results, the best time to send emails is on a Tuesday. (Omnisend))
- Regularly using “thank you” in email content generates higher returns. (Omnisend))
Email Copy
- Despite the fact that more than half of online consumers respond more positively to personalized content, only 2% of emails sent are actually personalized. (Smartinsights.com)
- Consumers also appreciate visually attractive content. 20% of businesses reported that improving their email design generated higher returns. (Hubspot)
- An average email sentence has 43 characters. In the same survey, only 6% of emails included emojis or other symbols. (AWeber)
- Adding the word “free” to emails originating from the restaurant and retail industries drastically improved consumer response by 20%. (Omnicore)
Mobile Email
- 48% of online users open and check their emails using their mobile devices. (Hubspot)
- The use of mobile devices for email has seen a significant increase of 80% in the past three years. (Emailmonday)
- 90% of online users use Apple products to open their emails, apparently because of its feature that displays content by default (Emailmonday)
- Having a mobile-responsive email design can result in a 30% higher click-through rate. (Invespcro.com)
- Women prefer using a tablet to open emails, while men prefer using their phones. (Emailmonday.com)
- 69% of online users will unsubscribe from a list if they find that the emails sent are not customized to cater to mobile devices. (Emailmonday.com)
Email Segmentation
- Around the world, segmented emails are 14.32% more likely to be opened and have a higher click-through rate than non-segmented ones. (Mailchimp)
- In 2016, the most opened email niche or category was pet and animal care (Mailchimp)
- 33% of internet users will decide whether or not to open an email based only on the subject line. (Mailchimp)
- Businesses have reported a 760% increase in ROI returns due to segmented email campaigns. (CampaignMonitor)
Digital Marketing Statistics-Video Marketing Statistics
Product Video
- 2018 was the year with the highest conversion rates for video marketing across several different industries around the world. (Emailstatcenter.com)
- 87% of marketing professionals say that video is one of their most widely used digital marketing tools. (Hubspot)
- The average internet user spends at least 6 hours every week watching videos online. (Wearesocail.com)
- More than 50% of online traffic is caused by video downloading or streaming (Nytimes.com)
Video Analytics
- The highest-rated video sharing platform is – no surprise – YouTube, with more than 88% of businesses saying that they use the platform for marketing purposes. Facebook comes in a close second at 76%. (Wyzowl)
- 54% of internet users say they prefer to see video content from brands or businesses they support. (Hubspot)
- 73% of consumers say that videos are their favorite content on social media (Animoto, 2018)
- 88% of video marketers are satisfied with the ROI of their video ads posted across different platforms (Animoto, 2018)
- 8 out of 10 internet users have purchased an app or a piece of software after watching a particular brand’s instructional/promotional video. (Oberlo.com)
YouTube
- As of date, YouTube has 2 billion monthly users. (Hootsuite)
- 15% of YouTube’s site traffic comes from users residing in the US. (Hootsuite)
- The average YouTube user spends at least 11 minutes per day watching videos on the website. (Hootsuite)
- 70% of the videos that internet users watch every day come from YouTube’s recommended algorithm. (Hootsuite)
- In the US alone, YouTube ad revenue amounted to more than 4 billion in 2019. (Hootsuite)
- 79% of internet users across the globe say they own a YouTube account. (Oberlo.com)
- 80% of businesses report that YouTube is their most effective and most widely used video-sharing platform for marketing purposes. (Hubspot.com)
- In the US, 90% of active YouTube users are between the ages of 18 and 44. (Statista.com)
- 90% of internet users say that they discovered new products and services by watching YouTube videos. (Thinkwithgoogle)
- Every minute, there are 500-hours worth of videos uploaded on YouTube. That number amounts to 30,000 hours of videos uploaded every hour. (Tubefilter, 2019)
- As of January 2020, 93% of the most-watched videos on YouTube are music videos. (Hootsuite.com)
- YouTube is available in over 91 countries and covers a total of 80 different languages, effectively catering to more than 90% of the world population. (Wearesocial.com)
Digital Marketing Statistics-Lead Generation Statistics
Source Omnicoreagency
Demand Generation
- 70% of businesses today measure the success of a campaign not by the number of leads generated, but instead lead-to-customer conversion rates. (Hubspot)
- Marketing teams spend more than 40 hours per month formatting and processing leads for database upload (Business2community)
- 88% of B2B marketers use content marketing as a lead generation tactic. (Impactbnd.com)
- Marketers who follow up on web leads within 5 minutes are 9 times more likely to see higher conversion rates. (Vendasta.com)
- The highest lead generation channel is LinkedIn with a rate of 64%. Facebook is a close second with 49% and Twitter with 36%. (Hubspot.com)
Marketing Automation
- Marketing automation has shown a huge impact on lead generation. Businesses using automation reported a 451% increase in qualified leads. (Salesforce.com)
- 71% of businesses today use marketing automation. (Salesfusion.com))
- 3 out of 5 companies, amounting to around 61%, said that the implementation process of marketing automation was difficult. (Hubspot.com))
- 63% of businesses have reported to out grow their online competitors in terms of sales because of using marketing automation. (Salesfusion.com)
Marketing Analytics
- In 2020, businesses are expected to spend more than 10% of their total budget on marketing analytics. (Hookagency.com)
- Only 44% of businesses say they can effectively measure ROI. (Convince and Convert)
- 67% of companies measure the success of their marketing campaign by using lead generation. (Hubspot)
- Only 25% of marketers collect customer data for proper measurement. (Thinkwithgoogle.com)
- In the US, only 10% of businesses say they are able to measure customer satisfaction “extremely well.” (Neilpatel.com)
Digital Marketing Statistics-Advertising Statistics
Ad blocking
- 47% of internet users worldwide have used an ad blocker in the past year. (Socialmediatoday.com)
- The top three reasons for ad blocking are: “too many ads” (48%), “annoying or irrelevant ads” (47%), “intrusive ads” (44%). (Blogarama.com)
- 31% of internet users who are most likely to block ads come from the ages between 16 and 24. (Global Web Index)
- The highest percentage of ad blocking occurs in search engines, at a rate of 39%. (Global Web Index)
- In the year 2017, the display ad market was worth around $100 billion but lost around 40% because of ad blocking. (Statista)
Mobile Advertising
- 53% of paid search clicks are done through mobile devices (WordStream)
- In the US alone, the yearly amount spent for mobile advertising amounted to $28.25 billion in the year 2019. (Neilpatelcom)
- 75% of Google mobile search ad revenue originates from Apple devices. (Marketingdive.com)
- Consumers engage with ads 2 to 4 times better when using mobile apps compared to websites. (Thnkwithgoogle.com)
- Google has the highest rate of mobile paid clicks at 95%. (Bluecorona.com)
Display Advertising
- “Banners and others” is the most popular category of display ads. This includes both social media and native search ads. (Emarketer)
- Native ads from blog posts and online articles generate 53% more views compared to traditional display ads. (Emarketer)
- Google currently has the widest reach for display ads. It reaches 90% of internet users across the globe. (SemRush)
- 72% of display ads are responsive and are used more than plain images. (Neilpatel.com)
Pay-per-click (PPC) Advertising
- Phone-based PPC ads cost 24% lesser than desktop and have a higher ROI rate at 40%. (Wordstream.com)
- Classified and local industry searches have the highest number of mobile clicks at a rate of 97%. This is followed by the business sector at 94% and the automotive industry at 86%. (Wordstream.com)
- The average PPC salary in the US is $49,941 per year. (99firms.com)
- 17% of businesses use PPC ads to generate leads. (360integralmarketing)
- 45% of small businesses around the world invest in PPC advertising. (Ppcprotect.com)
- PPC visitors are 50% more likely to go through with a purchase compared to organic visitors (Valveandmeters.com)
Video Advertising
- Social video ad spending is expected to grow by 44% in the year 2021. In the US alone, video ad spend is estimated to reach up to $14 billion. (Emarketer)
- Video ads are clicked 73% more times than static or display ads. (Spiralystics.com)
- The most popular video ads are YouTube ads that are viewed on mobile devices. They account for 83% of consumer attention. (Hootsuite.com)
- 51% of marketing professionals worldwide say that video ads have the best ROI. (Wordstream.com)
- Businesses who incorporate video ads into their brand campaign grow revenue 49% faster than those that don’t use video. (WordStream)
Digital Marketing Statistics-Marketing Technology Statistics
Messaging Apps
- 36% of consumers who use messaging apps also use at least two other kinds of apps. 16% are using 3 or more. (MediaKix)
- The average revenue for messaging apps in the year 2020 is more than $15 pre-online user. (MediaKix)
- 30% of online users who use a chatbox are more likely to communicate with a business and make a purchase. (Neilpatel.com)
- Facebook Messenger is used by more than 1.2 billion people across the globe. (Forbes.com)
Artificial Intelligence
- The Artificial Intelligence (AI) software market is expected to grow at a rate of 154% every year. (Statista)
- 82% of businesses in the US reported having a positive ROI as a result of incorporating AI initiatives into their marketing campaign. (Singlegrain.com)
- The past two years have seen the rise of popularity in Chatbots and they are expected to handle more than 80% of consumer communication by the year 2021. (Salesforce.com)
Digital Marketing Statistics-Sales Statistics
CRM
- 65% of companies using a mobile CRM are achieving their yearly sales targets. (SuperOffice)
- CRM software is the biggest software market in the world and is expected to generate more than $80 billion in revenues by the year 2021. (SuperOffice)
- 44% of businesses are planning to increase their CRM budget in 2021. (SuperOffice)
- 91% of businesses with more than 11 employees now use CRM. (SuperOffice)
Service Level Agreement (SLA)
- 23% of salespeople said that what they need most from their marketing team is “better quality leads.” (Hubspot.com)
- 58% of businesses in the US reported that they share common goals with their sales teams. This is higher than the rate in UK which is at 49%. (SalesForce)
Social Selling
- 78% of salespeople engaged in social selling are reaching their quotas faster than those who aren’t engaged in social selling. (Hootsuite.com)
- 76% of online buyers want to engage in a social media conversation with potential providers. (Optinmonster)
- 90% of the top-rated salespeople have incorporated social selling tools into their marketing strategy. (Optinmonster)
- 39% of businesses reported that social selling drastically reduced the time they spend on researching potential leads. (Optinmonster)
- 31% of professional sellers say that social selling has helped them build trust with current and potential clients. (Superoffice.com)
Digital Marketing Statistics-Digital Marketing Fun Facts
Digital Marketing is not just affordable and effective – it’s an ever-changing industry with a ton of interesting details that you may not have heard about.
Ready to jump in? Here are 20 digital marketing facts that are sure to pique your interest:
- In case it wasn’t already obvious, ours is now the online generation. In 2019, an estimated 4.39 billion people across the globe are using the internet. That’s a whopping 57% of the entire population! (Internet Live Stats)
- It took the internet just 4 years to reach 50 million users. For comparison: television took 13 years, while the radio took 38 years. (Embryo Digital)
- Digital marketing is taking over. By 2021, it’s projected that marketing leaders will spend at least 75% of their total marketing budget on digital platforms, rather than traditional ones like TV and radio. (Campaignmonitor.com)
- When it comes to digital technology, Asia still reigns supreme. The continent has the most internet users with a percentage of 49.7% in 2020 – with the majority coming from Japan and China. That’s almost half of the world’s online population! Coming in second is Europe at 16.8%, followed by Africa at 11%, and Latin America at 10.4%. (Futurefive.asia)
- The internet’s influence has extended to several industries, with the biggest shifts seen in advertising and marketing. With a growth spurt of 18.2% in 2015, the internet has now become the fastest-growing advertising platform in the world. (Whitesharkmedia.com)
- But while the internet continues to grow, our attention spans have unfortunately been decreasing. According to a study by Microsoft, the modern consumer’s average attention span is only 8 seconds. To give you an idea of how short that is: it’s 1 second less than the attention span of a goldfish! (bbc.com)
- Most of the online content comes from websites. As of January 2020, there are over 1.74 billion websites. (Webhostingrating.com)
- Out of this number, more than 85000 are hacked every day. At the top of the most-hacked list are WordPress and Joomla. (Lifehacks.io)
- First impressions matter. And when it comes to websites, it takes only 0.05 seconds for internet users to form an opinion about your website. (Sweor.com)
- Did you ever wonder why most websites put their most important information on the upper left corner of the page? That’s because studies show that internet users start viewing websites from the top left instead of the right.
- The world’s first-ever website was info.cern.ch – a basic HTML site with only a few lines of text. And get this: it’s still online until today! (History.com)
- In recent years, we’ve seen a drastic shift from desktop to mobile. Around 1.2 billion people use their mobile devices, particularly their phones, to access the internet. (Datareportal.com)
- In accordance with this mobile mindset, Smartphones have become an integral part of our daily lives. Today, 63% of women and 73% of men between the ages of 18-34 say they don’t go an hour without checking their mobile phones. (Pewresearch.org)
- The email has become one of the foremost digital marketing platforms, and it’s easy to see why. An average of 250 billion emails are sent out every day. 81% of this number consists of spam mails – an after effect of automated email software. (Reply.io)
- While we’re on the topic of emails, did you know that the first email was sent in 1971? The exchange was between two computers sitting right next to each other and contained a test message that said “QWERTYUIOP” – the first line of letters on the keyboard. (Towerdata.com)
- Of all the digital marketing platforms, social media is definitely the most popular. As of 2020, Emarsys has reported that 3.5 billion people are on social media. That’s about 45% of the entire population. (Emarsys)
- Millennials continue to be the generation with the highest use of social media, making up 90.4% of social media users. Gen X follows at 77.5% and Baby Boomers at 48.2%. (Emarketer)
- Facebook remains to be the leading and most popular social media platform; this is due in part to its easy interface. But did you know that Al Pacino’s face was the original Facebook homepage? It was the original design back when Facebook was still called “The Facebook.” (Mashable)
- SEO is an important aspect of digital marketing, but most people don’t realize that 51% of all internet traffic is actually fake. Various bots and spamming software cause more traffic than humans. (ppcprotect.com)
- According to 65% of marketers, link building is the most difficult SEO tactic. (Safaridigital.com.au)
Wrapping Up 200+ Digital Marketing Statistics
Pwee!! That’s it, over 200 digital marketing statistics to help you in your decision making for your business. I hope this has helped you to understand where you stand in relation to your competitors and marketing in general as well as other things happening in the world of business.
Don’t forget that when it comes to digital marketing statistics, numbers are very important. They give you a clear understanding of the condition of your industry and your niche.

